雅思写作真题(Task 1 小作文)
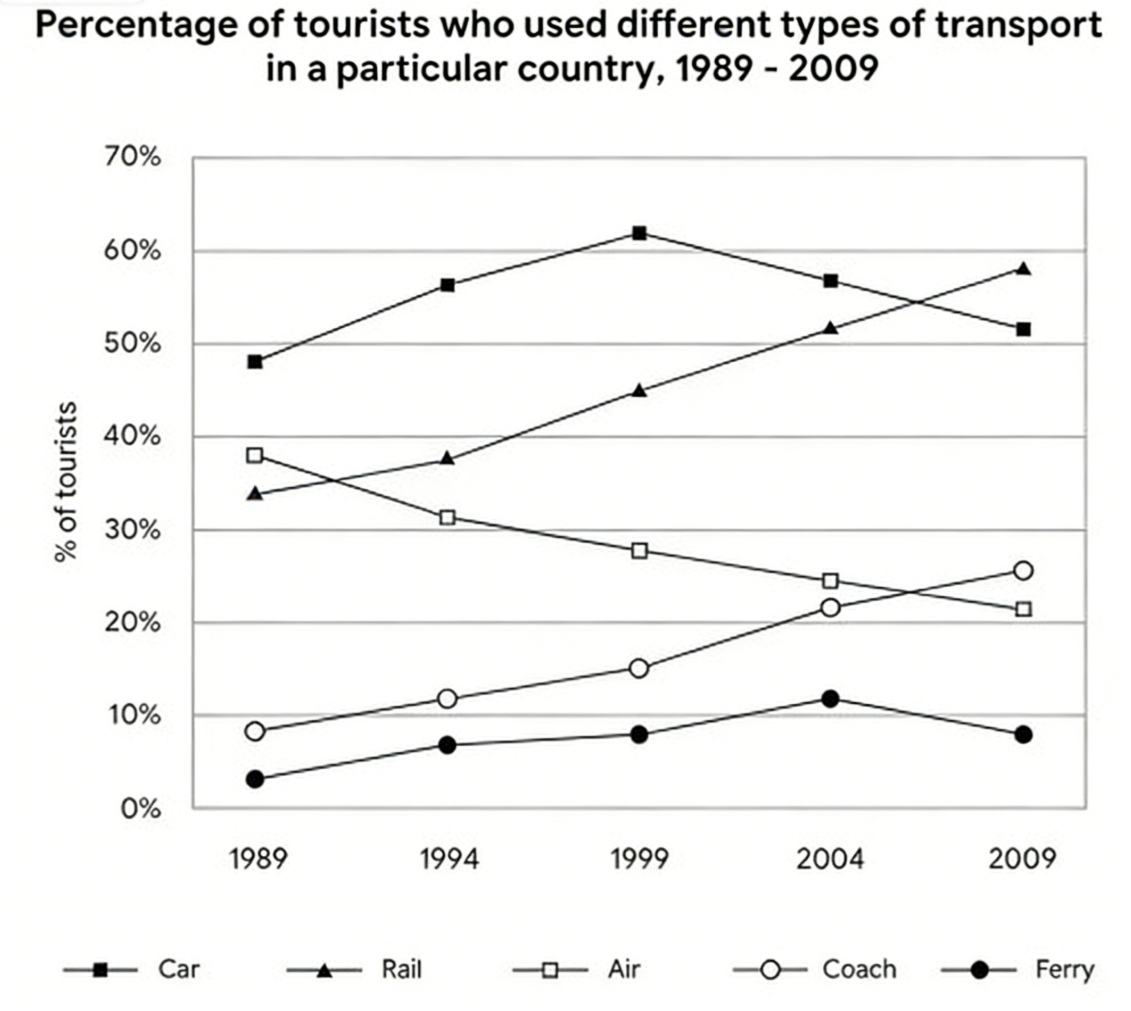
某国游客在境内使用不同交通工具出行的百分比
最近考试:2026.3.11西北工业大学
题目原文
The graph below shows the percentages of tourists who used different types of transport to travel within a particular nation between 1989 and 2009. Each tourist may have used more than one type of transport. Summarise the information by selecting and reporting the main features, and make comparisons where relevant.