雅思写作真题(Task 1 小作文)
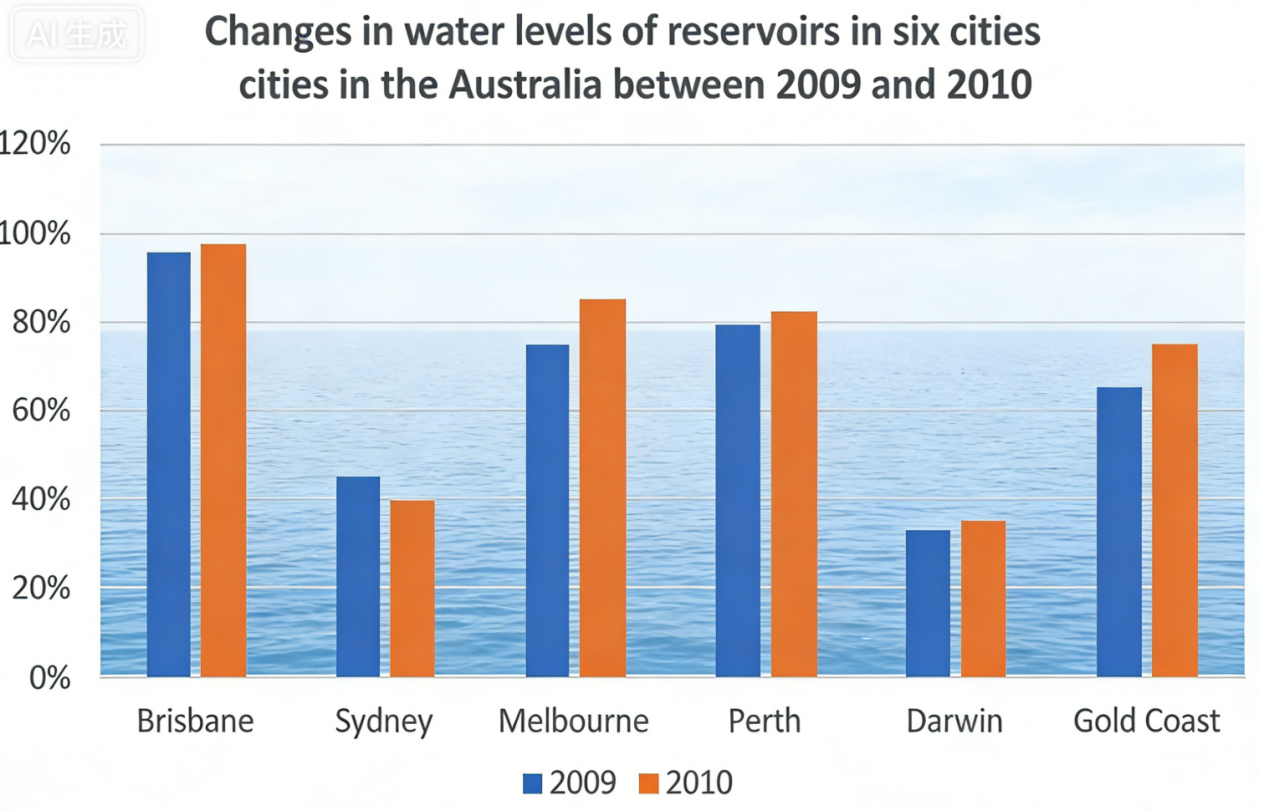
澳大利亚六个城市水库的水位
最近考试:2023.10.28
题目原文
The chart below shows the water levels in reservoirs in six cities in Australia in October 2009 and October 2010. Summarize the information by selecting and reporting the main features, and make comparisons where relevant.