雅思写作真题(Task 1 小作文)
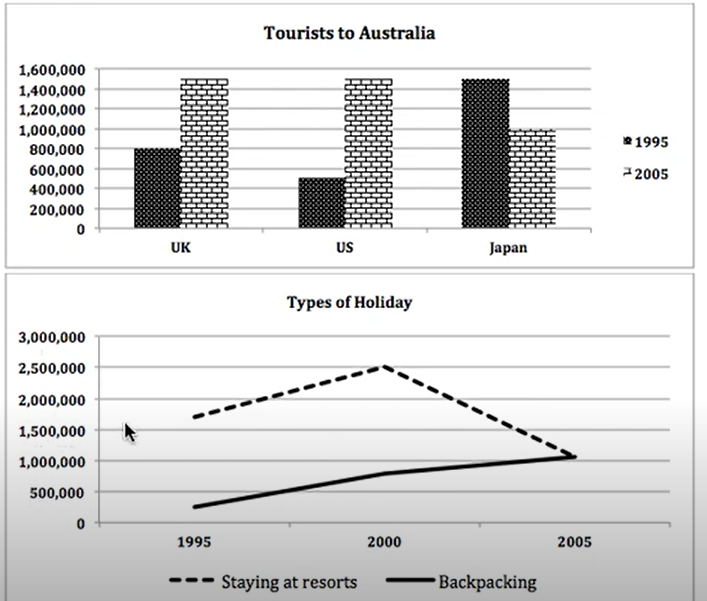
前往澳大利亚的游客数量与参与两类度假方式的游客人数
最近考试:2023.12.9
题目原文
The bar chart below shows the number of tourists who travelled to Australia in 1995 and 2005. The line graph shows the number of tourists who were on two types of holiday. Summarize the information by selecting and reporting the main features and make comparisons where relevant.