雅思写作真题(Task 1 小作文)
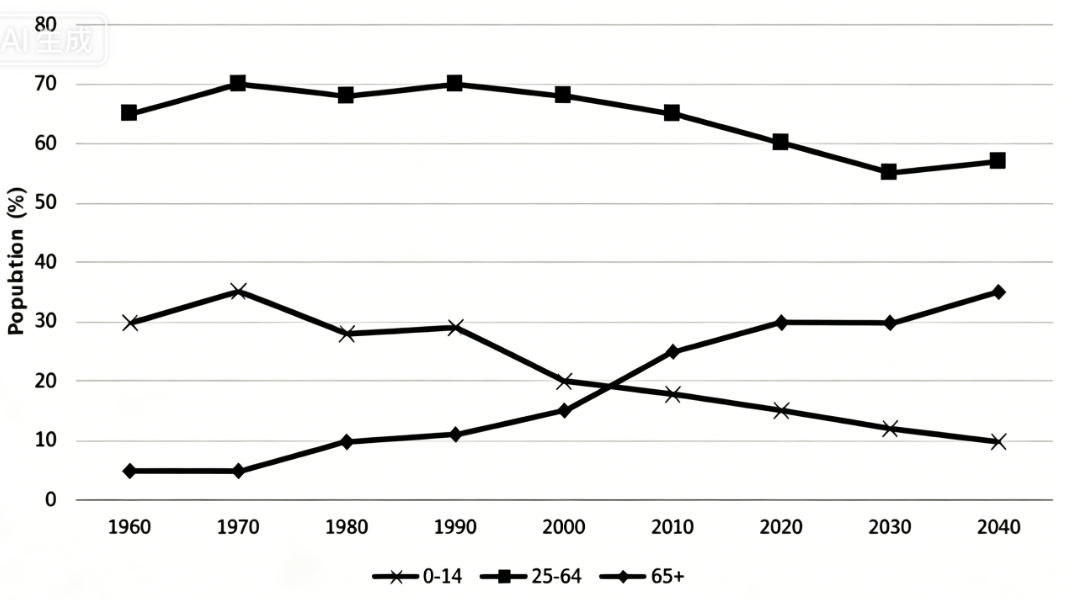
日本按年龄段划分的人口情况
最近考试:2026.4.17重庆BC雅思
题目原文
The chart below shows the Japan’s population by age groups starting in 1960 and including a forecast to 2040.Summarise the information by selecting and reporting the main features, and make comparisons where relevant.