雅思写作真题(Task 1 小作文)
诊所各岗位数量
最近考试:2026.3.21
题目原文
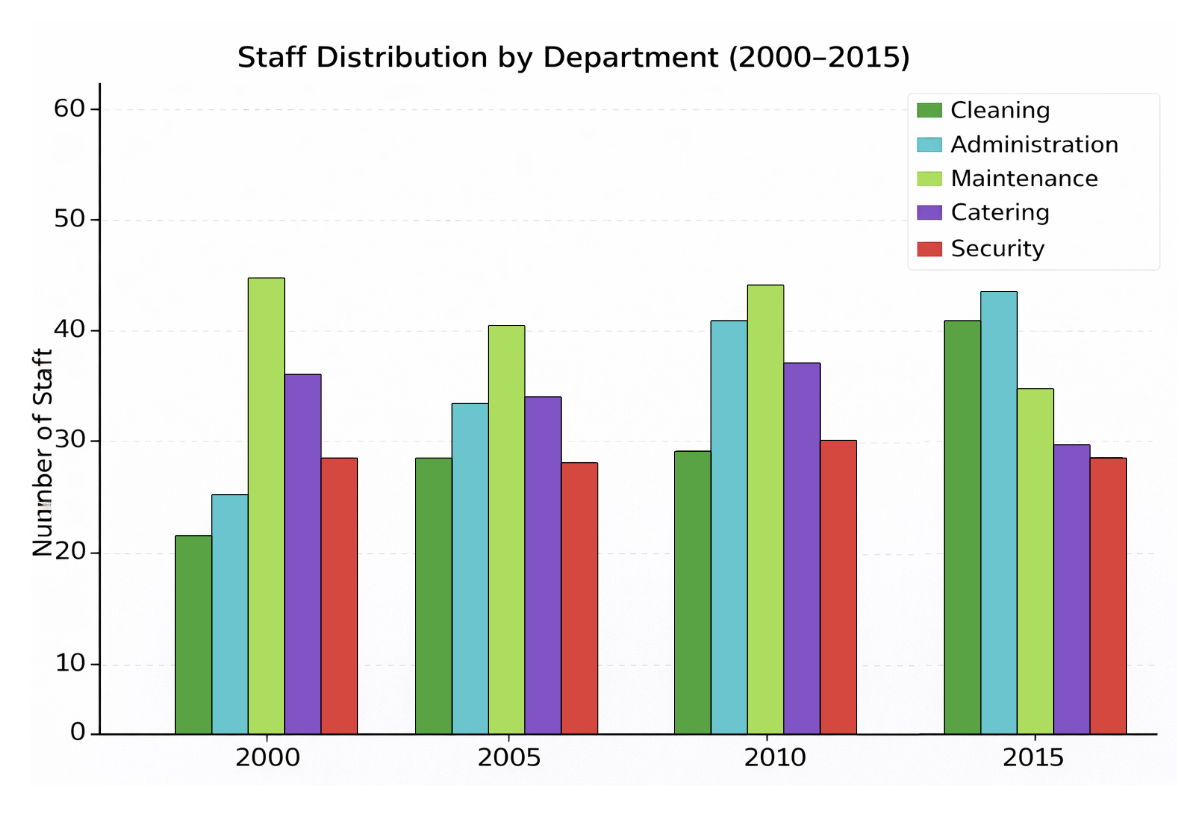
The bar chart shows the number of non-medical staff in a particular clinic between 2000 and 2015.Summarise the information by selecting and reporting main features, and make comparisons where relevant.
雅思写作真题(Task 1 小作文)
最近考试:2026.3.21
The bar chart shows the number of non-medical staff in a particular clinic between 2000 and 2015.Summarise the information by selecting and reporting main features, and make comparisons where relevant.