雅思写作真题(Task 1 小作文)
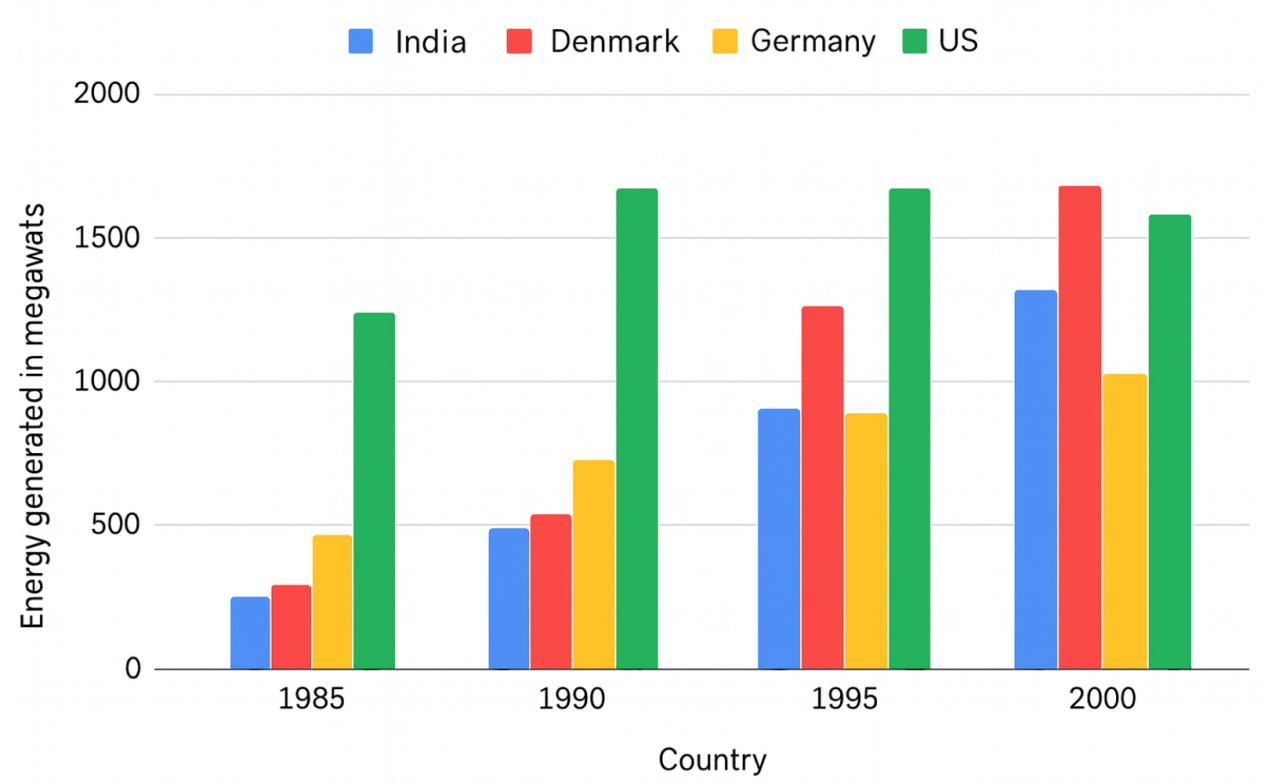
四个国家的风能发电量
最近考试:2020.6.28
题目原文
The chart below shows the amount of energy generated from wind in four countries from 1985 to 2000. Summarize the information by selecting and reporting the main features, and make comparisons where relevant.