雅思写作真题(Task 1 小作文)
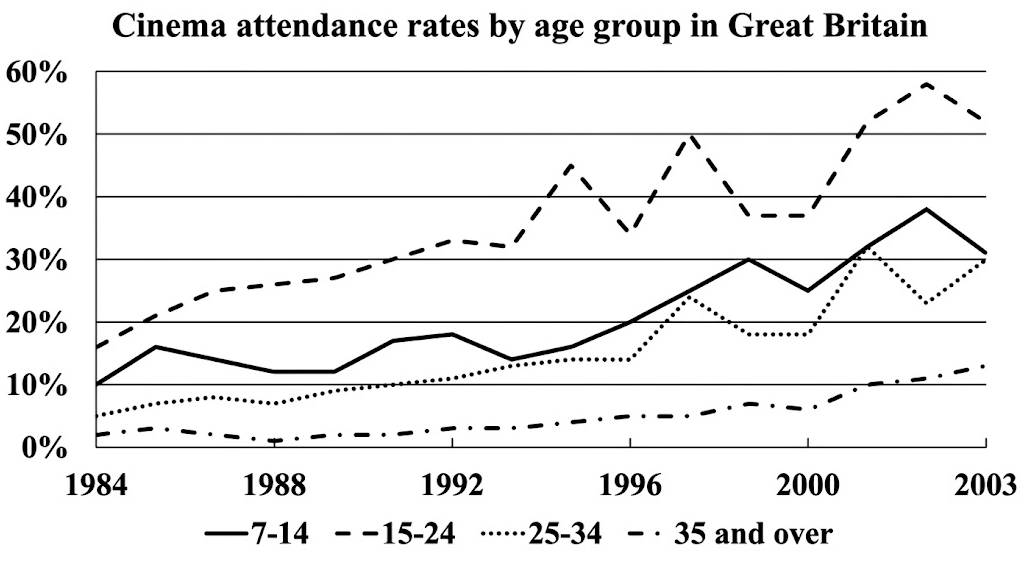
英国四个不同年龄段人群每月至少去一次电影院的百分比
最近考试:2024.7.27
题目原文
The graph below shows the percentage of four different age groups visiting a cinema once a month or more in Britain between 1984 and 2003. Summarise the information by selecting and reporting the main features, and make comparisons where relevant.